


Five Charts for the Week that Was: October 16, 2026
October 1 marks the start of the Federal Government Fiscal Year 2027. Normally, a report on the FY2026 budget (deficit) would be available by now, but it has not be Five Charts for the Week that Was: October 2, 2026
While the US economy has evidenced persistent, impressive resilience in the face of numerous challenges—second–quarter growth was recently revised upward, and third-quarter growth is estimated to be well above 2.5% Five Charts for the Week that Was: September 18, 2026
Yields on US 10-Year Treasuries – “the world’s most important asset,” according to Fed Chairman Kevin Warsh—continue to rise. Multiple factors are in play. Expectations for higher inflation and further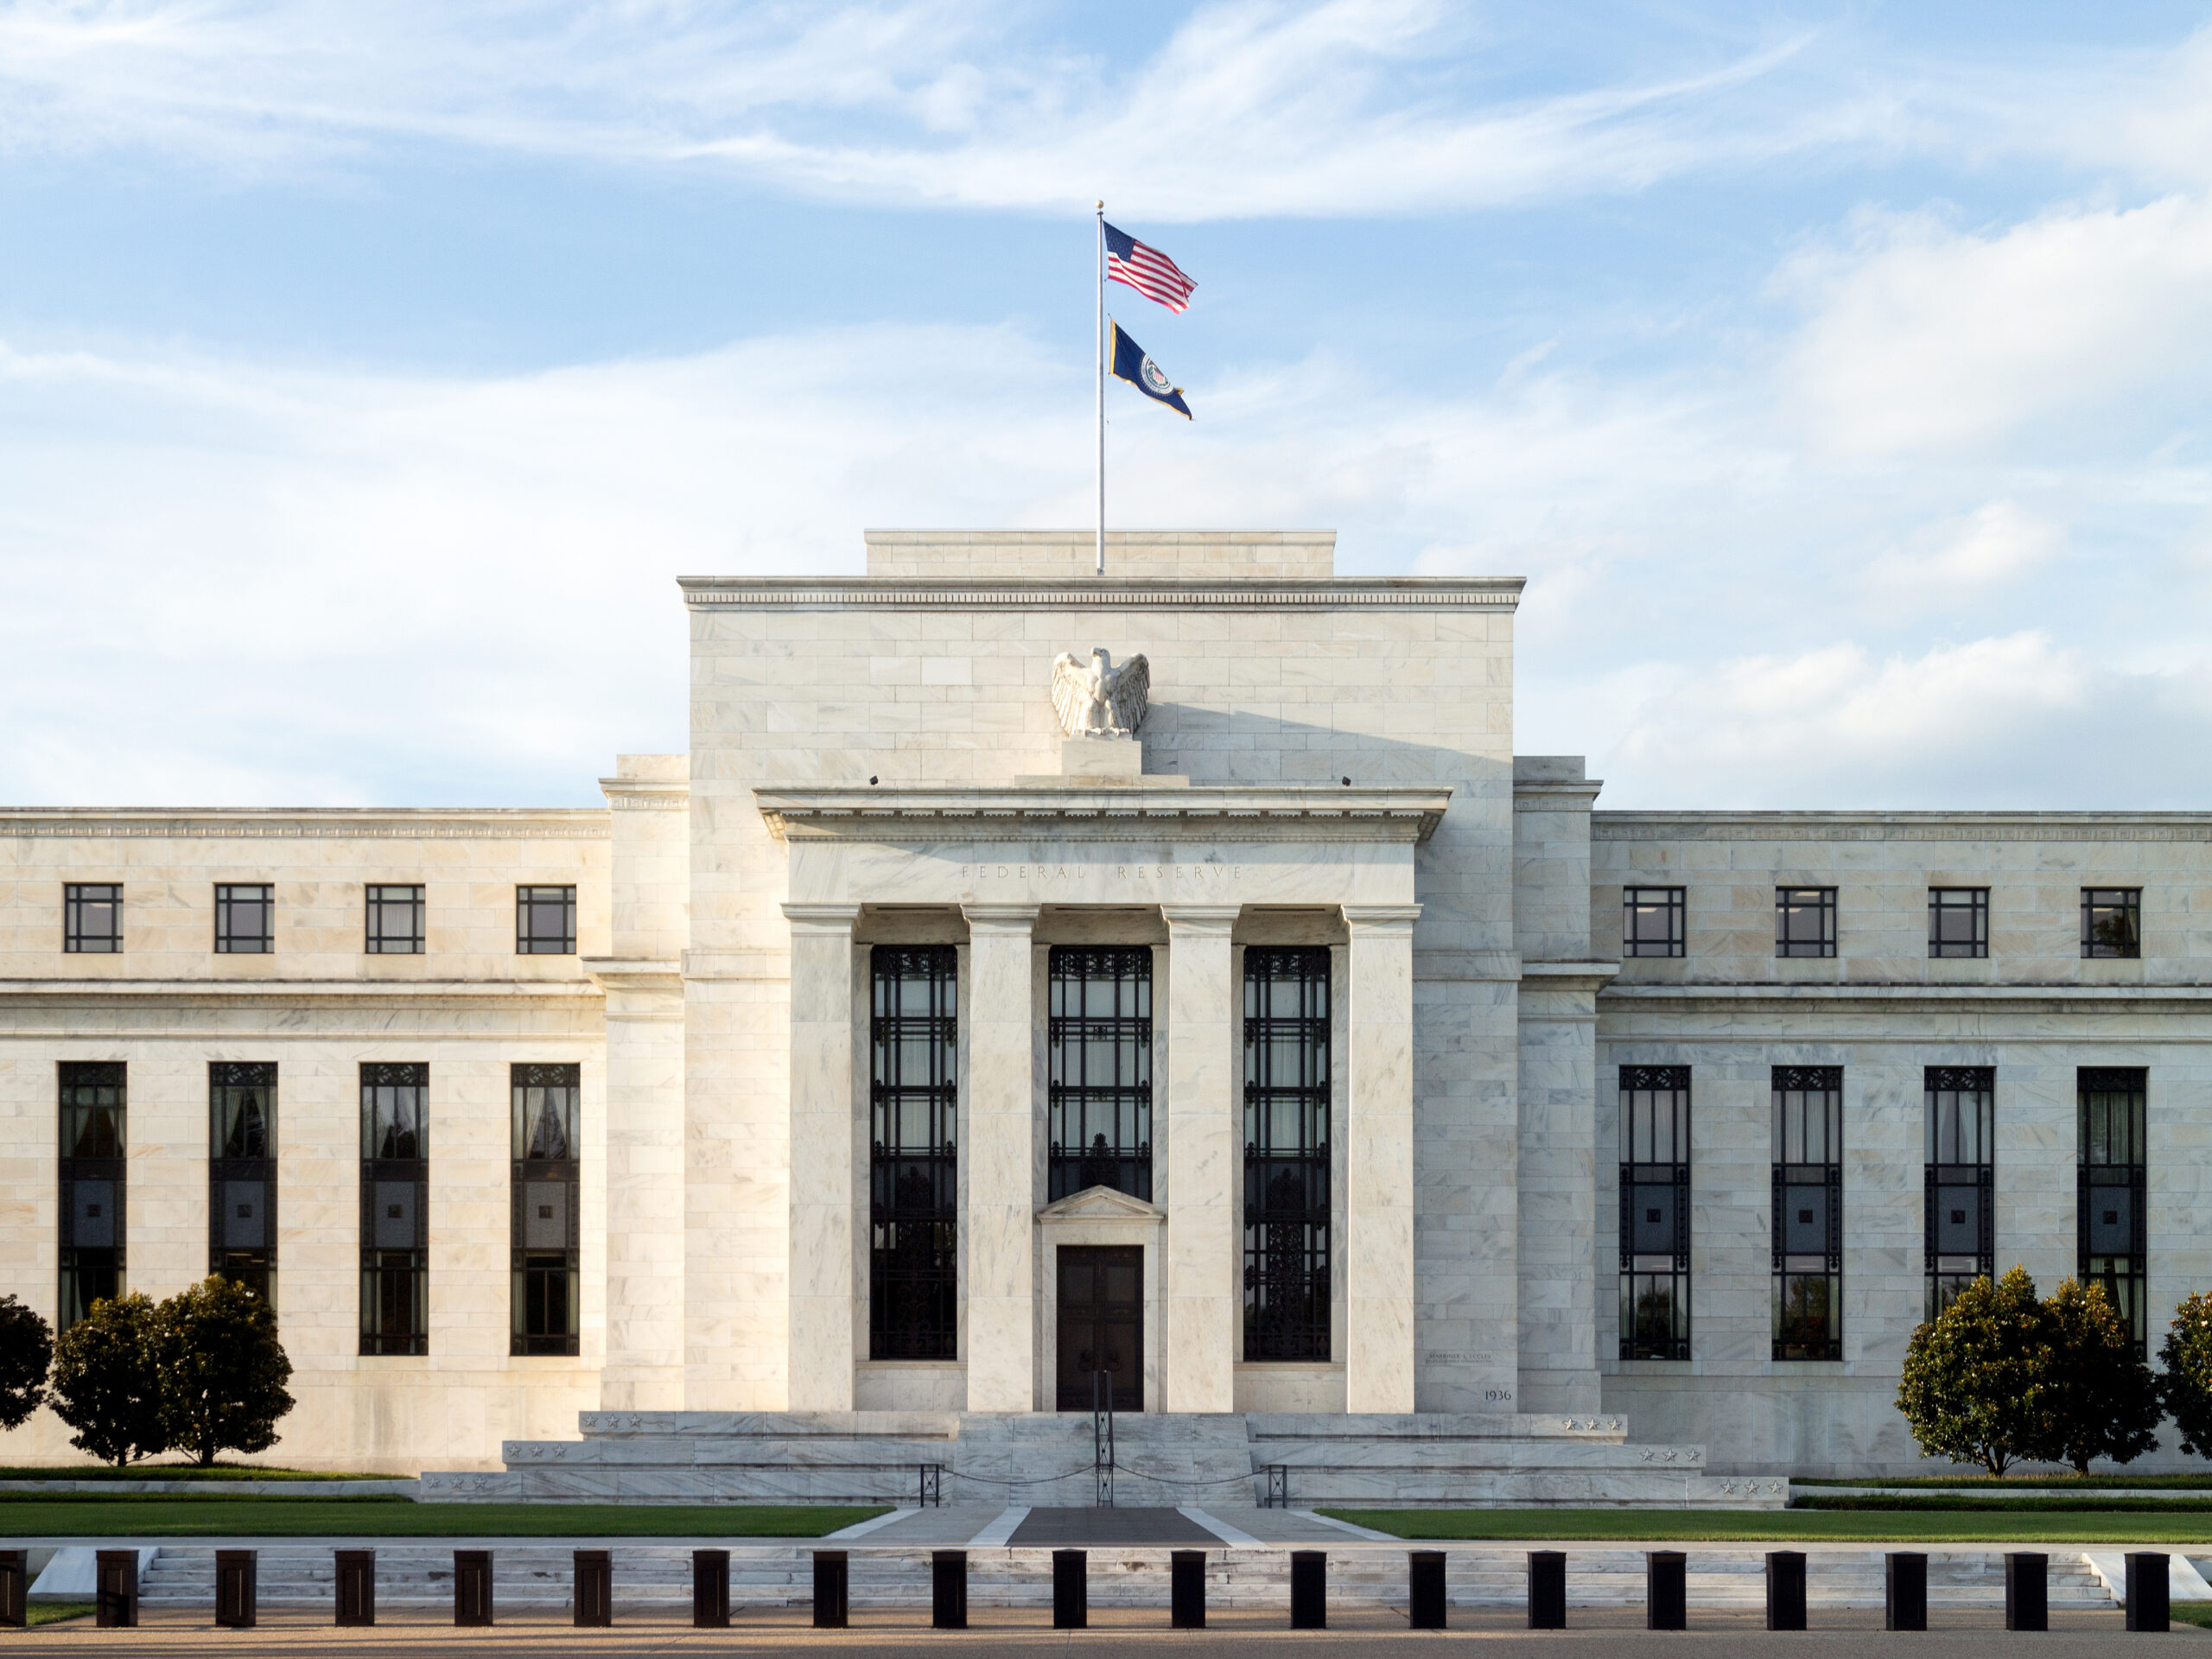
FOMC Commentary – A Hawk Spreads His Wings
The best way to understand the decision of the Federal Open Market Committee (FOMC) of the Federal Reserve to increase the target interest rate by one-quarter of one percent is Five Charts for the Week that Was: August 7, 2026
On Friday morning (August 7), the Bureau of Labor Statistics announced that net new job creation declined in July by 23,000 jobs. The Bureau also announced downward revisions to the FOMC Commentary – July 29, 2026
he Federal Open Market Committee (FOMC) elected to hold the target interest rate (Fed Funds rate) range at 3.25%-3.75%. This action was only a surprise to market traders who chose Ten Charts for the Week that Was: Webinar Bonus Edition
As a bonus edition of Charts for the Week That Was, we’ve included 10 charts featured in our Mid-Year Outlook webinar. If you missed it, you can watch the replay
2026 Mid Year Economic and Investment Outlook Webinar
July 22, 2026 – Tune in as Chief Economist Jeanette Garretty and Chief Investment Officer Stuart Katz break down what happened in the first half of the year and provide Five Charts for the Week That Was: June 26, 2026
On Tuesday, June 23, the US Congress passed the 21st Century ROAD (“Renewing Opportunity in the American Dream”) to Housing Act, a piece of legislation focused on increasing the supply